What is EU ETS & how does it impact Luxembourg’s industry?
1 What is EU ETS and how does it work?
A key tool for reducing greenhouse gas emissions
1997 Kyoto Protocol was one of the major initiators for the creation of the EU Emission Trading System (EU ETS). It implemented the objectives of the 1992 United Nations Framework Convention on Climate Change1, by committing signing state parties2 to reduce the onset of global warming by lowering greenhouse gas concentrations in the atmosphere. The EU, with its 15 Member States at the time, committed to reduce greenhouse gas emissions by 8% compared to 1990. This target had to be reached during the first commitment period of the Kyoto Protocol, between 2008 and 2012.
One of the major policy instruments designed to enable the EU to comply with the agreed 8% reduction until 2012 was the introduction of the EU Emission Trading System (EU ETS). First ideas for the design of EU ETS were presented in a Green Paper3 in 2000 by the European Commission. This paper served as a basis for numerous stakeholder discussions that further helped shape the system. The EU ETS Directive4 was finally adopted in 2003 and the system was launched in 2005.
EU ETS is designed as a cap and trade system. It sets a maximum level of pollution – a cap – and distributes emission permits or allowances among firms that produce emissions. The cap is an absolute quantity of greenhouse gases that can be emitted by the factories, power plants, and other installations included in the system, in order to ensure that the emission reduction target is met. Installations integrated in ETS need to present permits for each unit of pollution they produce. They can obtain permits either through an initial allocation, through auctioning them, or through trading with other firms in the system. Since some companies inevitably find it easier or cheaper to reduce pollution than others, trading takes place. Whilst the maximum pollution quantity is set in advance, the trading price of permits fluctuates, becoming more expensive when demand is high relative to supply – for example when the economy is growing – and cheaper when demand is lower – for example in a recession. The price of pollution is therefore created as a result of setting a ceiling on the overall quantity of emissions.
Today, EU ETS represents the world’s first and by far largest emission trading market. It accounts for over three-quarters of the international carbon trading5. EU ETS operates in all 31 countries of the European Economic Area (EEA), including all 28 EU Member States plus Iceland, Liechtenstein, and Norway. It limits emissions from more than 11,000 energy-intensive installations, mainly power stations and industrial plants, as well as over 500 airlines operating between the EEA countries. As such, the system controls about 45% of the EU’s greenhouse gas emissions today6.
EU ETS Phases 1-3 (2006-2020): How the system evolved over time
Phase 1 of EU ETS was launched in 2005 as the first such system ever. There were many unknowns in terms of its concept and operation. The goals of Phase 1 running from 2005 to 2007 was thus to test how the system would affect the concerned sectors within and outside the EU with its then 27 Member States. Focusing on Co2 emissions7 only, the system covered its major emitters: Power stations and other combustion plans with a thermal input superior to 20 megawatts. It further covered so-called energy-intensive industries, such as oil refineries, coke ovens, iron and steel plants, and producers of cement clinker, glass, lime, bricks, ceramics, pulp, paper, and cardboard products.
Over the course of the three phases, the scope of the EU ETS kept increasing in terms of geographic scope, sectors8, and greenhouse gases. Likewise, the goal of emission reduction became more ambitious from one phase to the next. Table 1 shows how the main features of EU ETS evolved over the years.
Following the experiences in Phase 1, EU ETS also continuously adapted how to set and manage the emission cap, the allowances, and which tradable units the system includes. The next chapters will shed light on these major aspects of the system.
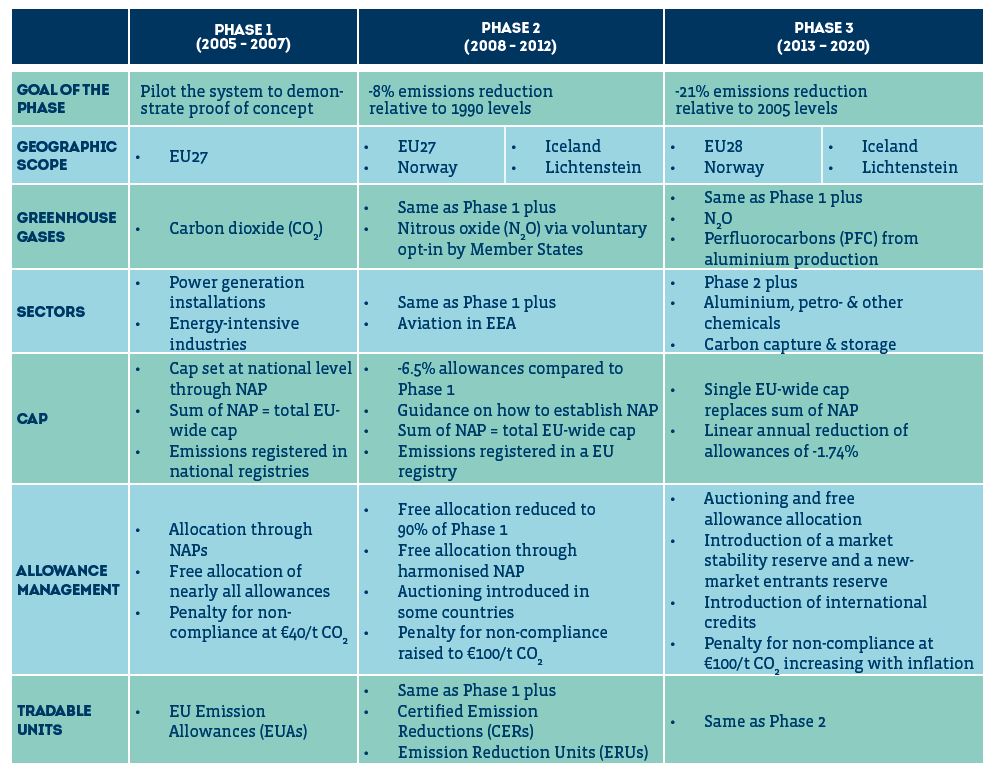
Table 1: Main features of EU ETS evolving over the phases
Determining and managing the cap
In the absence of reliable emission data in 2005, determining the cap in Phase 1 was obviously a major challenge. The first cap was established based on estimated amounts of allowances each installation would need per year. These estimates were decided by each Member State and published in National Allocation Plans (NAPs). These plans proposed an allocation of a certain number of allowances to their national installations over the duration of the trading period. The EU-wide cap was determined by the sum of all NAPs. In 2005, the total number of allowances issued exceeded, however, the real emissions during Phase 1 and, with supply significantly exceeding demand, at the end of Phase 1, the trading price of allowances fell to zero.
The approach to determine the annual EU-wide cap from the sum of the National Allocation Plans (NAP) remained the same also for Phase 2. The cap’s upper annual limit of tonnes of CO2 equivalent emissions to be undercut was determined at the beginning of the phase. The total annual amount of CO2 equivalent emissions in Phase 2 was reduced by 6.5% compared to Phase 1 and the annual amounts stayed the same during one period without being gradually reduced.
Starting in 2013, in Phase 3, an EU-wide cap was set centrally and not as the sum of NAPs anymore. The cap for 2013 for fixed installations was set at 2,084,301,856 allowances, each of them corresponding to 1 tonne of Co2 equivalent emissions. During Phase 3, this cap has decreased each year by a linear reduction factor of 1.74%. This linear reduction factor (LRF) was set in line with the EU-wide climate action targets for 2020 – the overall 20% emission reduction target and the EU ETS sector-specific 21% emission reduction target relative to the emission targets for 2005.
Since 2009, a surplus of emission allowances has built up in EU ETS. This surplus was largely due to the economic crisis of 2008-2009. According to the Financial Times9, by the end of 2016, EU ETS had an oversupply of 1.7bn tonnes’ worth of allowances, compared to emissions from installations covered by the scheme of 1.75bn tonnes. In other words, tradable market inventory equated to almost 100% of annual demand, reducing the market price of allowances. To prevent the price of the allowances to continue falling and further weakening the incentive to reduce emissions, one initiative conceived by the European Commission was a market balancing mechanism called the Market Stability Reserve (MSR). Starting from 2019, unallocated allowances will be taken from the market and transferred into this reserve. The MSR will operate entirely according to predefined rules that leave no discretion to the Commission or the Member States in its implementation and determining whether and how many allowances shall be placed in the reserve or whether allowances shall be released into the market.
Allowance Management
How is the total number of free allowances determined?
In Phases 1 and 2 of EU ETS, the number of free allowances to be allocated to installations was determined by the National Allocation Plans (NAPs). Poor transparency and weakly harmonised allocation methods of NAPs across Member States in Phase 1 unveiled, however, the risk of competitive distortions between different industries from different Member States. Therefore, the European Commission issued guidelines on how to establish NAPs in Phase 2.
Although in Phase 3 auctioning is the default method of allocation, free allocations are still handed out. The total number of free allocations in Phase 3 is, however, no longer calculated by NAPs, but instead by so-called National Implementation Measures (NIMs). NIMs are elaborated by all Member States in order to preliminary calculate the number of free allowances for each installation within their territory based on EU-wide harmonised rules for free allocations. NIMs must apply benchmarks to calculate the number of free allocations for each installation and product.
Benchmarks are based on the average greenhouse gas emissions of the best performing 10% of the installations producing that specific product within the EU. The benchmarks are based on the principle of ‘one product = one benchmark’. In other words, being focused on the product, the methodology does not vary according to different production technologies, fuels used, the size of an installation, or geographical location. For non-product-based emissions, i.e. for the production of heat, there are heat- or fuel-benchmarks. For installations producing more than one product, the installation is subdivided into “sub-installations” with separately applicable benchmarks. There are 54 benchmark values in total.
The Commission limited the total amount of free allocations in Phase 3 to approximately 43% of the total cap of the phase. As the requested allocations in the NIMs for all installations in the EU exceeded this total number of available free allocations, the allocations per installation were further reduced by the same percentage for all installations. This cross-sectoral correction factor (CSCF) was applied as of 2013. The correction factor reduced allocations by around 6% in 2013. As the number of allowances available decreases each year, the correction factor increases each year until 2020 when it will reach approximately 18%. Once all NIMs are centrally consolidated, assessed and adapted at EU level, the free allocations are issued yearly. Member States are responsible for final allocations and data collection.
What installations can benefit from free allowances?
In Phases 1 and 2 of EU ETS, allowances were mostly allocated for free to all installations, even though, starting from Phase 2, a few countries began experimenting with auctioning.
In Phase 3, the free allocation rule becomes more specific and restrictive. It distinguishes between installations from three different sectors that can take advantage of different shares of the available number of free allocations:
- Power generation sector, i.e. electricity producing installations. They are fully subjected to auctioning and cannot claim any free allocations.
- Industrial (non-power) and heating sector. They can claim free allocations according to the above-described performance benchmarks during a transitional period from 2013 to 2027. In 2013, 80% of the total quantity determined by the free allocation rules for the industrial sector will be allocated for free, decreasing to 30% in 2020, with a prospect of 0% in 2027.
According to this method, in 2013 for example, installations that met or exceeded the benchmarks, received at least 80% of allowances they need in order to cover their emissions for free. Installations that did not reach the benchmarks received much fewer allowances for free than they need. For such installations, ETS suggests three options to compensate missing allowances:i. Reducing their emissions;
ii. Auctioning additional allowances or credits to cover their emissions, or
iii. Combining the two above options. - Industry sectors exposed to the risk of carbon leakage. Carbon leakage refers to the situation that may occur if, for reasons of costs related to constrains by EU ETS, businesses were to transfer their production to other countries with lower emission restrictions. The mainly concerned industry sectors and subsectors are the ones facing competition from industries outside the EU that are not subject to comparable climate legislation. Typically, such industries produce energy-intensive products having a high-trade intensity, for example steel, aluminium, fertilisers, or cement products. Based on these two criteria, the European Commission produces and updates a list of exposed sectors or subsectors every five years. Installations on this list can claim free allocations of 100% of their eligible amount during Phase 3.
The clear majority of industrial installations host an activity considered to be at risk of carbon leakage — in 2014 only 2% of industrial emissions were caused by installations whose activity was not deemed at risk of carbon leakage10.
Free allowances in the third trading period from 2013-2020 can also be claimed by new installations or installations that significantly extend their capacity. As this number of allowances could not be foreseen in its entirety at the beginning of the trading period through the NIMs process, they are taken from a pool of allowances called New Market Entrants Reserve (NMR). Allowances allocated in this way are submitted to the existing rules as described above.
Finally, in eight Eastern European Member States11, some installations in the electricity generating sector continue to receive transitional free allocations in order to help modernise electricity generation. Power plant operators benefiting from such free allocations can use them to finance retrofitting, to upgrade infrastructure, to install clean technology or for the diversification of their energy mix or sources of supply.
How to calculate the allocation amount per installation?
The amount of allocations, measured in tonnes of CO2 equivalent emissions for each installation in EU ETS, is calculated based on the following formula:
Allocation = Benchmark × HAL × CLEF × LRF or CSCF
This is the amount of CO2 equivalent emissions an installation must not exceed and for which it must be able to present allowances.
- Benchmark, measured in CO2 equivalent emissions per tonne of product: Applicable are product-, heat-, or fuel-benchmarks. In case neither of those benchmarks apply, it is possible to calculate a process emission benchmark based on historical emissions.
- HAL, Historical Activity Level measured in tonnes of product: indicates the medial historical production level per year corresponding to the applicable benchmark.
- CLEF, Carbon Leakage Exposure Factor: Constant 100% or decreasing factor, depending on carbon leakage status. Sectors exposed to carbon leakage will receive free allowance allocations up to 100% of the relevant benchmark until 2020. For all other industries, the CLEF is reduced to 80% of allowances up to their relevant benchmark for free in 2013. This percentage then annually decreases to 30% in 2020 and 0% in 2027.
- LRF (Linear Reduction Factor) or CSCF (Cross-Sectoral Correction Factor): Reduction factors applied to ensure that the total free allocations stay within the limit of the overall EU ETS cap.
- LRF: applies to electricity generators. The LRF reduces the total allocation annually by 1.74% compared to the allocation in 2013.
- CSCF: applies to the industrial (non-electricity
generating) sector to ensure that the free allocations remain below the emission cap for non-electricity generators, the so-called industry cap.
Significant fines can be imposed if companies fail to comply by the request to provide enough allowances in time. In Phase 3, they are set at EUR 100 per tonne CO2 and rising with EU inflation. In addition, companies face an obligation to surrender the allowances owed. This is to ensure that the cap and its environmental targets can be maintained effectively.
What and how is traded in EU ETS?
The default trading units in EU ETS are the European Union emission allowances (EUAs). Starting from Phase 2, however, also other types of international credits can be used for compliance under EU ETS. International credits can be obtained by investing in projects that are certified under the Kyoto Protocol and contribute to reducing greenhouse gas emissions. Projects must be implemented according to two distinct mechanisms, called The Clean Development Mechanism (CDM) or the Joint Implementation (JI) mechanism, both are certified under the Kyoto Protocol.
Although subject to quantitative, and since Phase 3 also qualitative rules, the basic idea of international credits is to allow industrial countries with a greenhouse gas reduction commitment to invest in projects that reduce emissions in other developing (i.e. CDM) or industrialised (i.e. JI) countries as an alternative. Through the realisation of such projects, international credits can be generated and converted for the use in EU ETS.
Trading of EU ETS allowances (EUAs) is implemented through two auctioning platforms, the European Energy Exchange (EEX) in Leipzig, and ICE Futures Europe (ICE) in London. Figure 1 shows the evolution of EUAs’ trading price in Phase 3 whereas one EUA allowance entitles its holder to emit one tonne of CO2 equivalent gas. The prices of EUAs had been stagnating at a rather low level since the global financial crisis but have multiplied by five since autumn 2017 to around EUR 25 per tonne. As a matter of fact, EU ETS has seen a significant influx of speculative capital driving the prices. The increasing demand is based on the widespread expectation that the accumulated surplus of non-used carbon allowances will start to disappear from January 2019, when the Market Stability Reserve (MSR) will start operating. The MSR will reduce the oversupply of allowances by restricting the annual flow of new EUAs into the market (see also Chapter EU ETS Phase 4) and the market surplus is expected to fall by more than 1bn tonnes (or more than 60%) over 2019-202313.
The auctioning of allowances is governed by the EU ETS Auctioning Regulation. It covers the timing, administration, and other aspects of auctioning to ensure it is conducted in an open, transparent, harmonised, and non-discriminatory manner. According to the European Commission14, more than 80% of the revenues generated by auctioning allowances are being used for climate and energy purposes.
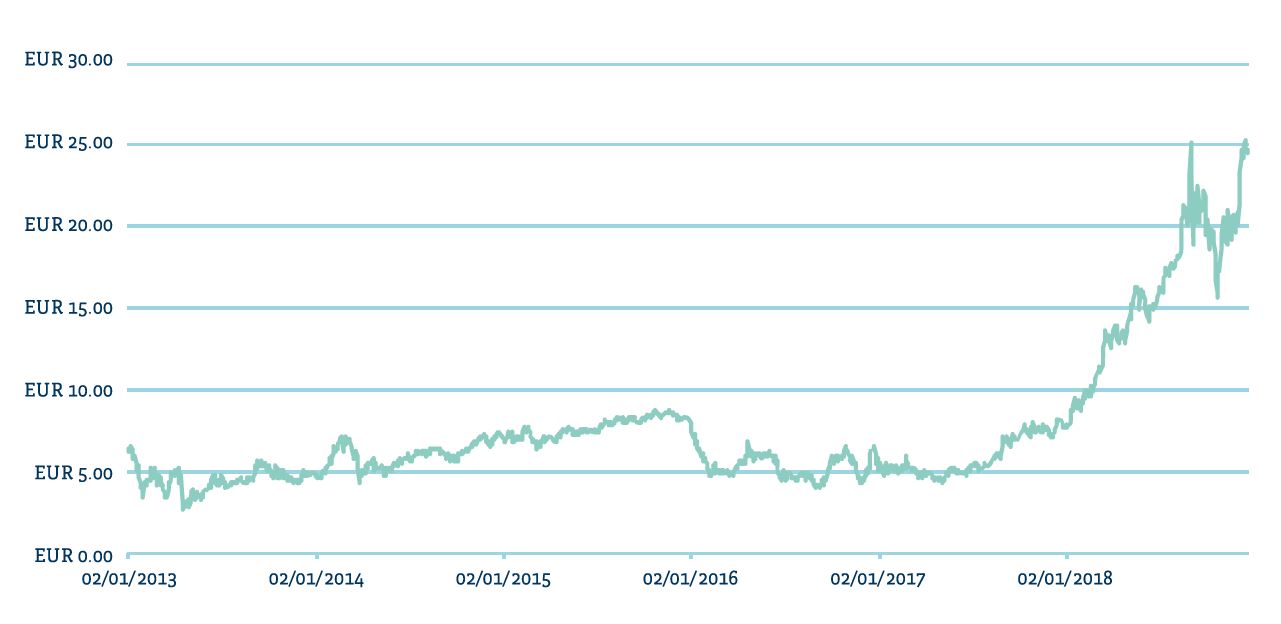 Figure 1: Evolution of trading price of European Emission Allowances (EUAs) in Phase 3 12
EU ETS Phase 4 (2021-2030)
In Phase 4 (2021-2030), the sectors covered by EU ETS have to reduce their emissions by 43% compared to 2005 levels. The following aspects are the new main elements of Phase 4:
- The cap on emissions will be subject to an annual linear reduction factor of 2.2% from 2021 onwards, compared to 1.74% in Phase 3;
- The Market Stability Reserve (MSR) doubles the amount of allowances to be put in the reserve to 24% of the allowances in circulation between 2019 and 2023. The regular feeding rate of 12% will be restored as of 2024;
- 100% free allowances will continue to be given to sectors with the highest risk of carbon leakage, and thus of relocating their production outside of the EU;
- Free allocation for sectors with lower risks of carbon leakage is foreseen to be phased out after 2026 from a maximum of 30% to 0% at the end of Phase 4 (2030);
- The 54 benchmark values determining the level of free allocations to each installation will be updated twice in Phase 4 to reflect the continuous technological progress;
- Free allowances will be set aside for new and growing installations. This number consists of allowances that were not allocated from the total amount available for free allocation by the end of Phase 3 (2020) and 200m allowances originating from the MSR;
- An Innovation Fund and a Modernisation Fund will be set up as low-carbon funding mechanisms to help energy-intensive industrial sectors and the power sector to meet innovation and investment challenges of the transition to a low-carbon economy. Both funds will extend the existing support known under the name NER300 program. NER300 is the world’s largest funding programme for innovative low-carbon energy demonstration projects. The programme is conceived as a catalyst for the demonstration of environmentally safe carbon capture and storage (CCS) and innovative renewable energy (RES) technologies on a commercial scale within the European Union.
2 Impact of EU ETS
A mitigated result AT EU level
The previous chapters explained the concept as well as major characteristics of EU ETS. It should be evident by now that the system is far from being trivial or lean to manage. In its quest to reduce CO2 emissions of the EU’s most energy-intensive industries, it enforces an administrative as well as non-negligible competitive burden to the EU’s industry by imposing a price on emissions.
Looking, however, at the overall outcome in terms of how CO2 emissions evolved since the introduction of EU ETS, the results seem rather mitigated. Figure 2 shows – in different colours for the Phases15 1, 2, and 3 of EU ETS – how CO2 emissions of all industrial installations covered by EU ETS evolved since the introduction of the system in 200516. It is important to compare emissions within one and the same phase as they include a different range of industries and a different set of CO2 equivalent emissions (see Table 1).
Even though the volume of industrial output has grown about 10%17 between 2005 and 2017, the data from Figure 2 does not suggest that the system was able to produce a significant reduction of CO2 emissions in each of its three phases, other than compensating for industrial output growth. A notable reduction can only be reported between 2008 and 2009. It is, however, safe to assume that this reduction is due to a global slow-down of industrial output because of the global recession triggered by the collapse of Lehman Brothers in September 2008.
The impression given by Figure 2 is even more paradoxical since the EU’s energy-intensive industry has made notable progress in reducing greenhouse gas emissions. In fact, energy-intensive industries have played an important role in helping Europe meet its current climate ambitions. According to Wyns18, energy-intensive industries have reduced their greenhouse gas emissions by 36% and account for 28% of the total economy-wide emission reductions by the EU between 1990 and 2015, even though they represented 15% of EU total GHG emissions in 2015 (18.4% in 1990)19.
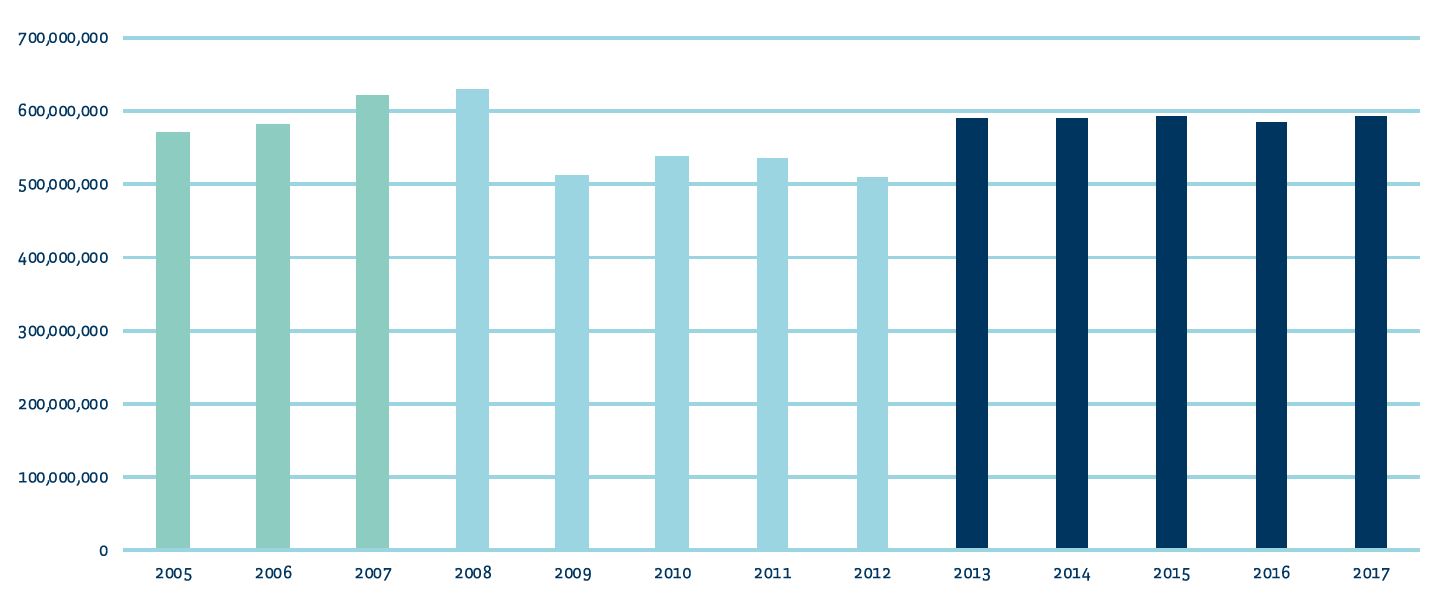
Figure 2: Evolution of emissions by all industrial installations (excl. combustion) since the introduction of EU ETS, in tonnes of CO2 equivalent emissions
These reductions are a result of a combination of factors:
- Improvements in energy efficiency
- Fuel switching, including increased use of biomass
- Closures and lower production levels or capacity utilisation in some sectors, particularly in the aftermath of the economic crisis of 2008
- Deep reductions of non-CO2 GHG emissions in chemical and fertiliser production (N2O and fluorinated gas emissions reduced by 93% between 1990 and 2015 in these sectors.)
Wyns further argues that “not only have energy-intensive industries more than disproportionately helped reduce emissions from their own sectors, but also contribute to emission reductions in other sectors like transport, buildings, waste, and power generation. Today, Europe’s energy-intensive industries are at the forefront of low-carbon solutions”.
Impact on Luxembourg’s industry during Phase 3
By the end of 2017, Luxembourg had a total of 21 fixed installations covered by the EU ETS system. It includes
- 15 industrial installations associated to one of the EU ETS sectors identified as energy-intensive;
- 6 installations that generate heat and/or electricity over a cogeneration installation using a combustion technology. They can be associated to the EU ETS
“industrial (non-power) and heating” sector.
Focusing on the 15 industrial installations, Luxembourg’s portfolio of energy-intensive installations includes producers of steel, aluminium, cement and clinker, glass, construction and plastic materials. Luxembourg’s overall share of CO2 emissions from the industrial non-combustions sector is relatively small and only accounts for 0.22% of all emissions covered by EU ETS20. It is further worth noting that most national industrial non-combustion installations are exposed to carbon leakage risks entitling them to receive free allocations. An analysis of how these installations cope with the constraints of the EU ETS system in Phase 3 shows that except for the cement production, most of the concerned companies manage to gradually decrease the emission output of their installations.
Figure 3 shows the evolution of the number of surrendered allowances by all industrial (manufacturing/production) installations in Luxembourg for the period since 2013 (red line)21. It is obvious that the number of free allocations handed over to those installations (dark blue line) is not sufficient to cover all emission needs. Hence, the concerned companies need to fill the gap of the missing allocations by auctioning them on the market. The bars in Figure 3 visualise how the auctioning impacts the costs of producing under EU ETS. Knowing that prices of EUA allowances have severely increased since autumn 2017, estimated direct additional operational costs of at least EUR 3.5m by 2018 and over EUR 5m in 2019 and 2020 can be projected22. The projections however clearly reveal that the concerned industry sectors struggle to reduce the number of allowances they need to surrender. Considering the introduction of MSR starting from 2019, EUA prices are expected to further increase, this effect will be compounded by a higher annual linear reduction factor of the overall cap starting in 2020: -2.2% instead of -1.74%.
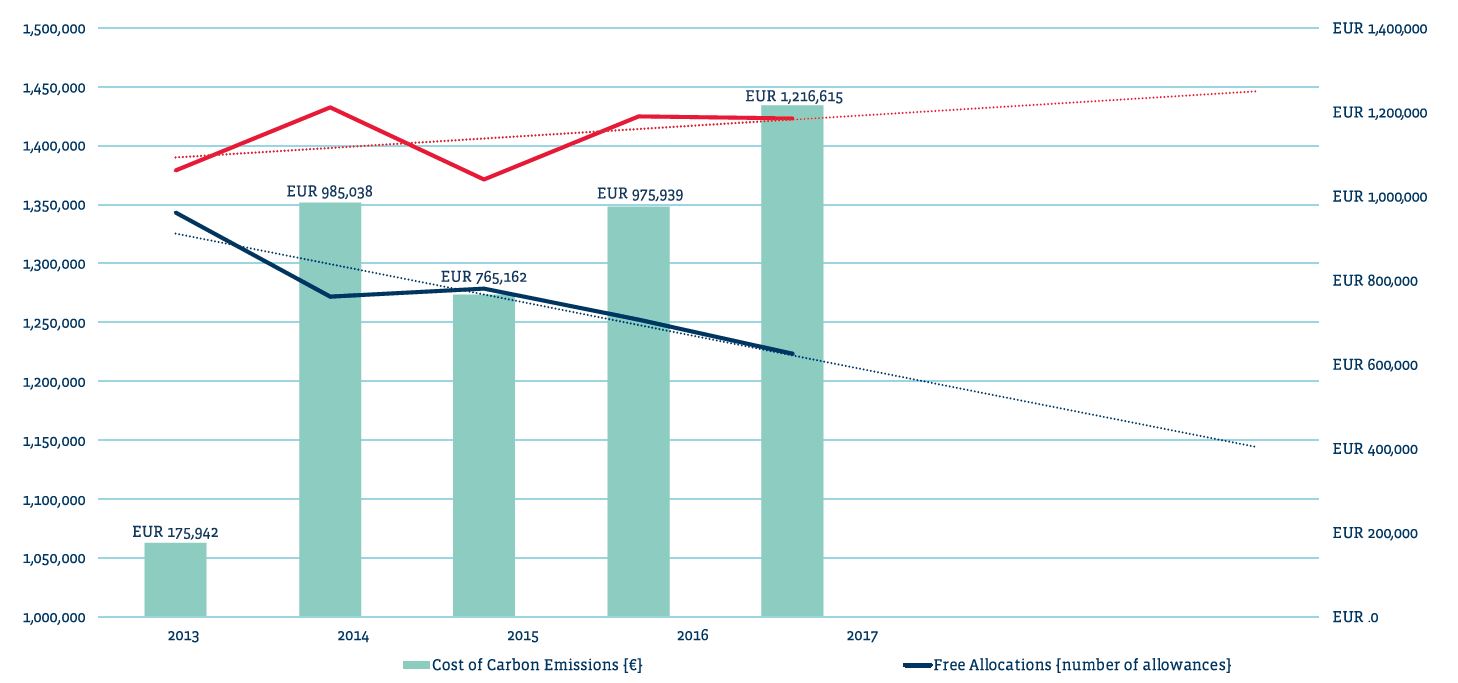
Figure 3: Key figures for all Luxembourg-based industrial installations covered by EU ETS since the start of Phase 3; linear trend projections are dotted
Apart from the direct additional costs caused by EU ETS, the system also impacts concerned companies by increasing indirect costs. Indirect costs come in the form of a higher electricity bill as electricity producers themselves are impacted by EU ETS. Increasing electricity costs can pose a risk to the most electricity-intensive businesses, particularly to the ones operating in internationally competitive markets. To alleviate this risk, the European Commission allows Member States to pay compensations for indirect costs of EU ETS. In Luxembourg, the parliament voted23 in favour of such compensation payments only recently, in mid-2018. The list of eligible sectors and products is defined in an EU guideline24.
The increasing additional costs that EU ETS imposes to Luxembourg’s industry penalise its global competitiveness and risk to gradually change established market dynamics. The following chapter shows how the cement, steel, and glass production in Luxembourg is affected.
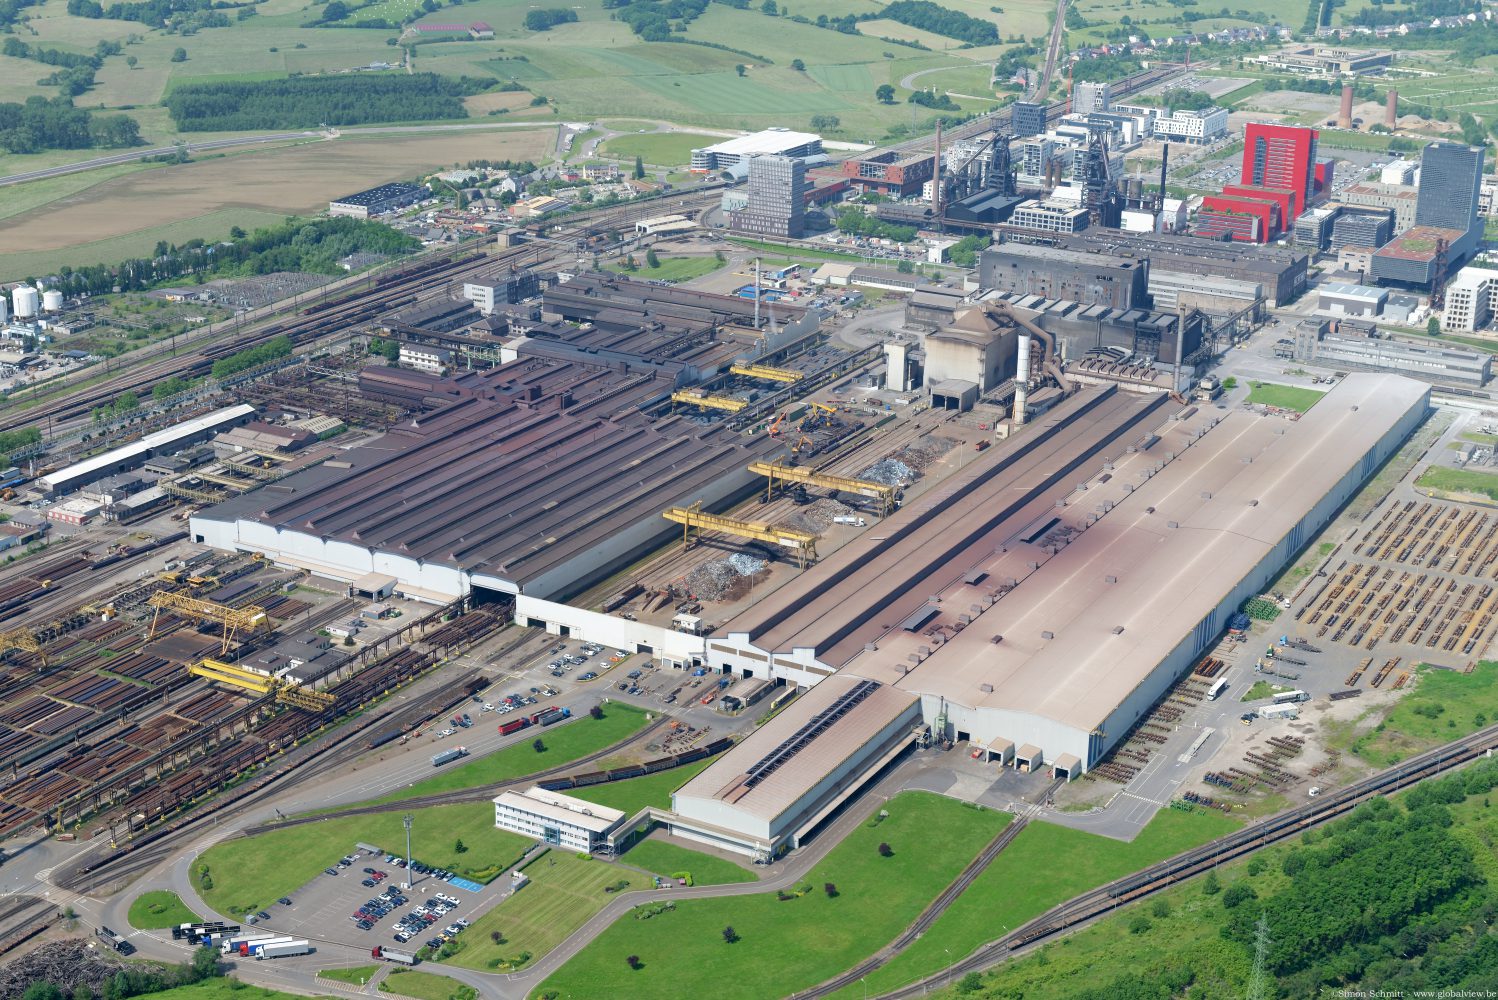
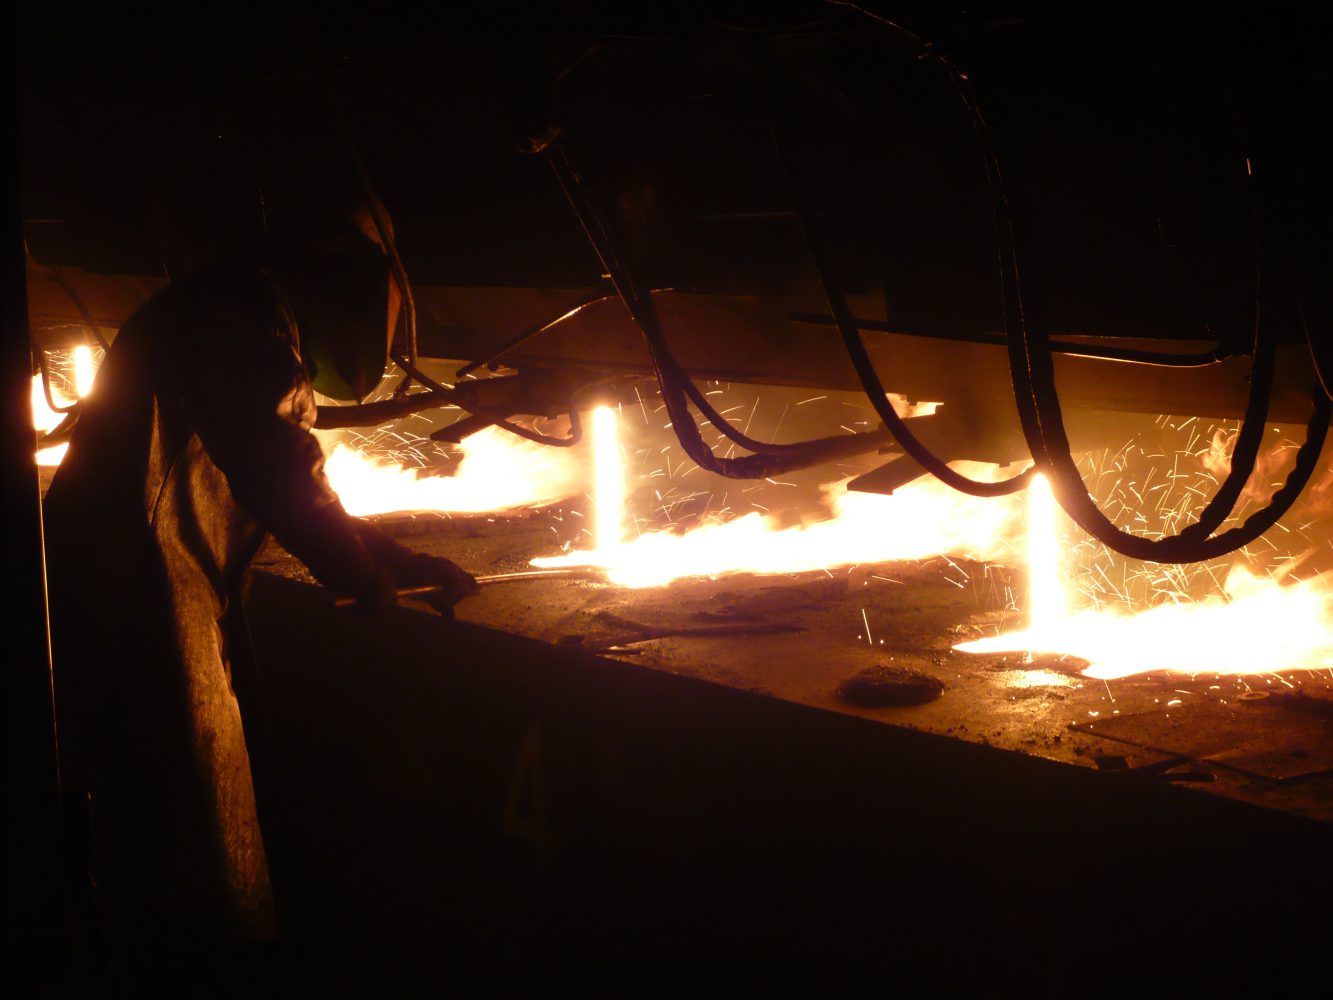
Steel production: The case of ArcelorMittal
ArcelorMittal25, the world’s leading steel and mining company is present in Luxembourg through nine sites, including five industrial production sites and its world-wide corporate headquarters. It employs more than 4,000 people locally. ArcelorMittal’s contribution to Luxembourg’s economy has been uncontested in the past, and in 2018 it injected nearly EUR 500m into the local economy through wages, employer’s contributions and expenditures paid to local suppliers.
Steel products manufactured in Luxembourg include some of the most highly specialised in the sector, such as the heavy sections from the Differdange plant or the sheet piles produced in Esch-Belval. Roland Bastian, General manager and CEO – Head of Country Luxembourg explains that ArcelorMittal Luxembourg has produced a total of 2.2m tonnes of crude steel in 2018, using 95% recycled material.
In fact, ArcelorMittal Luxembourg’s two liquid steel production installations in Differdange and Esch-Belval can be considered as modern and highly technological production sites. Both use electric arc furnaces to melt recycled scrap metal material, ferrous alloys and iron slurry. The material is melted predominantly through electric energy which is induced via electrodes, as well as by adding fossil energy in the presence of oxygen. Relying almost entirely on recycled material and electric energy, this crude steel production process is not only highly resource-efficient, it also reduces the overall environmental footprint of steel making. Mr Bastian confirms that crude steel as it is produced in Luxembourg is 75% less CO2 intensive than traditional steel making in blast furnaces.
Steel is 100% recyclable as scrap. It can be reused repeatedly without any loss of quality. Therefore, scrap is a valuable raw material for steel production and there is a well-established international market for metal scrap. The worldwide steel consumption is, however, still increasing. Demand for new steel products currently exceeds the amount of scrap available, so that crude steel production from blast furnaces melting iron ore is still inevitable.
It is the versatility of steel that drives its demand, besides its most obvious use as an industrial base material for example in the automotive, aeronautical, shipbuilding, or machine industries, it is widely used as construction material in infrastructure, commercial, and residential projects. Steel products are also used in packaging, in electronics and household appliances. It is this versatility that drives a huge worldwide demand making steel production contribute to approximately 7%-9% of worldwide anthropogenic CO2 emissions.
The European steel industry is thus contributing to reach the EU climate objectives. The steel sector’s emissions dropped by 25% from 1990 to 2010. Despite the industry’s ongoing efforts to further reduce CO2 emissions of steel production, EU ETS is creating a difficult situation for EU-based steel makers as they must compete on the global market. Mr Bastian confirms: “Steel is and has always been a highly traded good”. Most of the steel is not used in its country of production but is shipped to other markets. In other words, EU steel products that include additional costs inflicted by EU ETS lose competitiveness on the world market, when facing steel products made in China, the US, Canada or Japan. Even though some of these countries have their own emission trading systems, their energy-intensive industries are mostly exempt and consequently their products do not include similar additional costs; or they may even be subsidised in some cases.
To prevent the kind of competitive disadvantage described above, the EU ETS system foresees free allocation of allowances for energy-intensive industries, including the steel industry. According to Mr Bastian, however, the design of the benchmarks that determine the initial amount of free allocations as well as the pace of annual reductions of those free allocations are hardly corresponding to the technological feasibility or to business reality of the steel industry today. “We need fundamental changes in steel production technologies to keep track with the decarbonisation objectives as set by the EU”, Mr Bastian explains, and adds: “ArcelorMittal is working on such technologies, but they are far from being ready on an industrial scale today”. In fact, ArcelorMittal is currently engaged in multiple research and development (R&D) or further advanced pilot plant projects specifically dedicated to either directly avoiding or reducing CO2 emissions. One of those research projects, co-financed by the EU Horizon Europe programme, sets out to demonstrate the reduction of 50-80% CO2 in a handful of installations by 2034. This time horizon, as well as the scale of deployment, shows that massive efforts are needed to accelerate the technology readiness of low CO2 emitting steel production technologies and to make them available to a major part of the industry.
Without correcting measures, the current climate policy constraints, however, risk deteriorating the economic attractivity of EU steel making. Even if in 15 years from now solutions were available, deployment in the whole industry would need further effort and investment. One option for such a correcting measure without compromising set climate objectives might be the introduction of Border Adjustment Taxes (BAT) for imports of steel from non-EU countries with laxer emission regulations.
There are different concepts of border adjustment taxes (BAT). A tax can either be levied at the import of emission intensive steel produced outside of the EU, or at the moment it is consumed as a transformed steel product. For example, if a non-EU-based steel maker ships steel into the EU, where it will be used to produce cars, the profit of the non-EU company on the exported steel is not taxed. However, the EU-based car-manufacturer purchasing such steel from outside the EU either bears a tax directly at the moment of import or, later the profit the car maker generates from the cars (including that steel) when it is consumed – in other words sold – in the EU is taxed. In addition, the car company cannot deduct the cost of the imported steel as a business expense. Those taxes must be adapted according to the CO2 intensity of the imported steel product. Products with low CO2 intensity would undergo lower taxation.
The BAT must further be coupled with subsidies compensating EU steel makers for additional EU ETS costs to restore their competitiveness when exporting to the world market. “This way the currently missing level playing field for all market participants could be created and bring back EU producers’ product margins that can be reinvested into low CO2 R&D efforts” Mr Bastian states. Furthermore, it can be expected that such a measure could incentivise other countries to introduce similar climate actions to promote low emission steel production of their industry to avoid a BAT of their products.
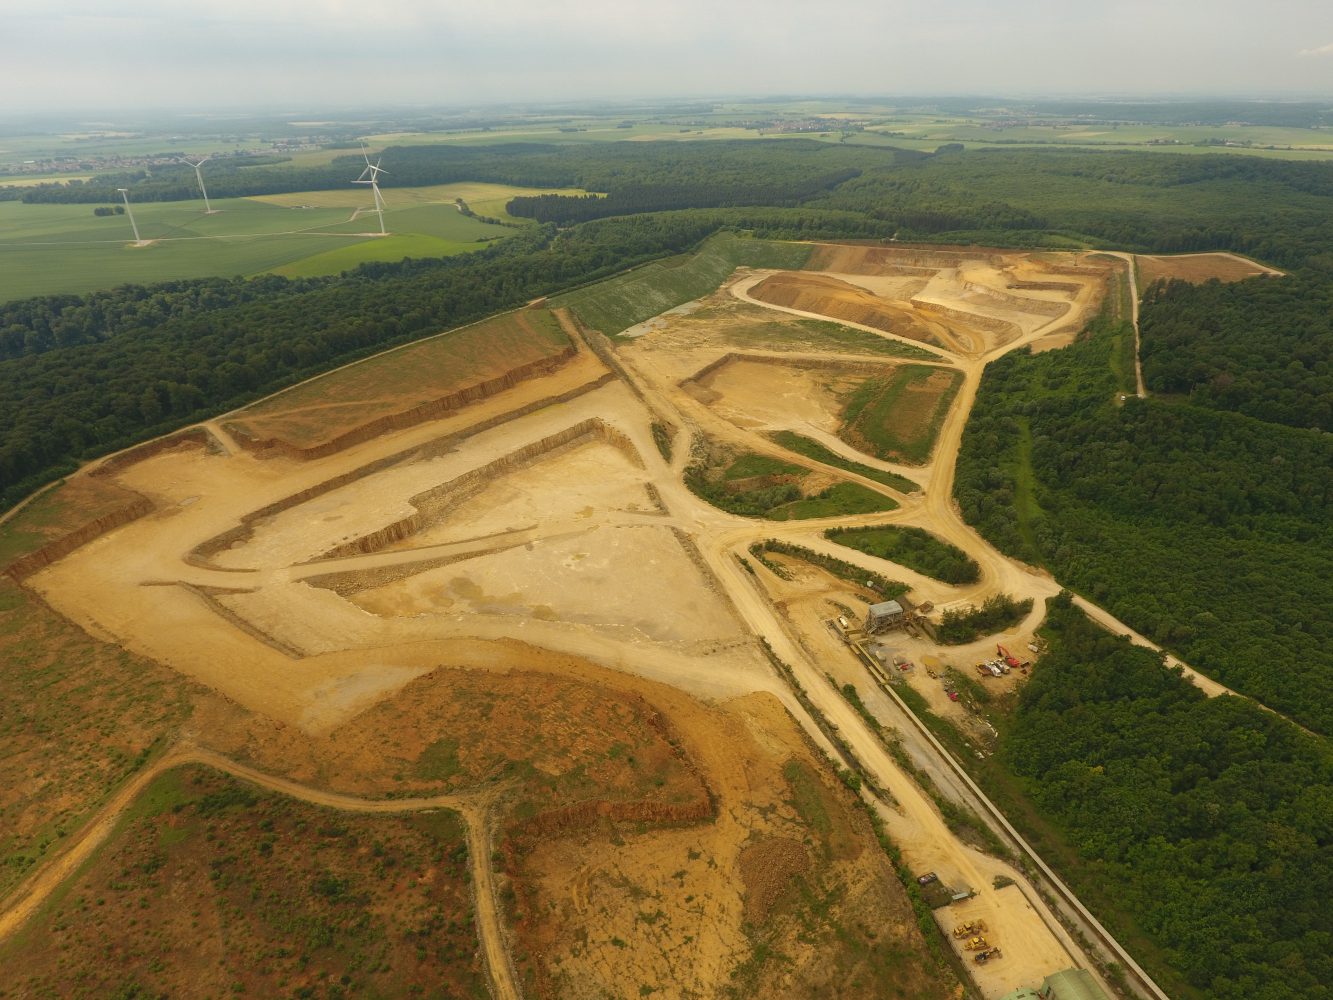
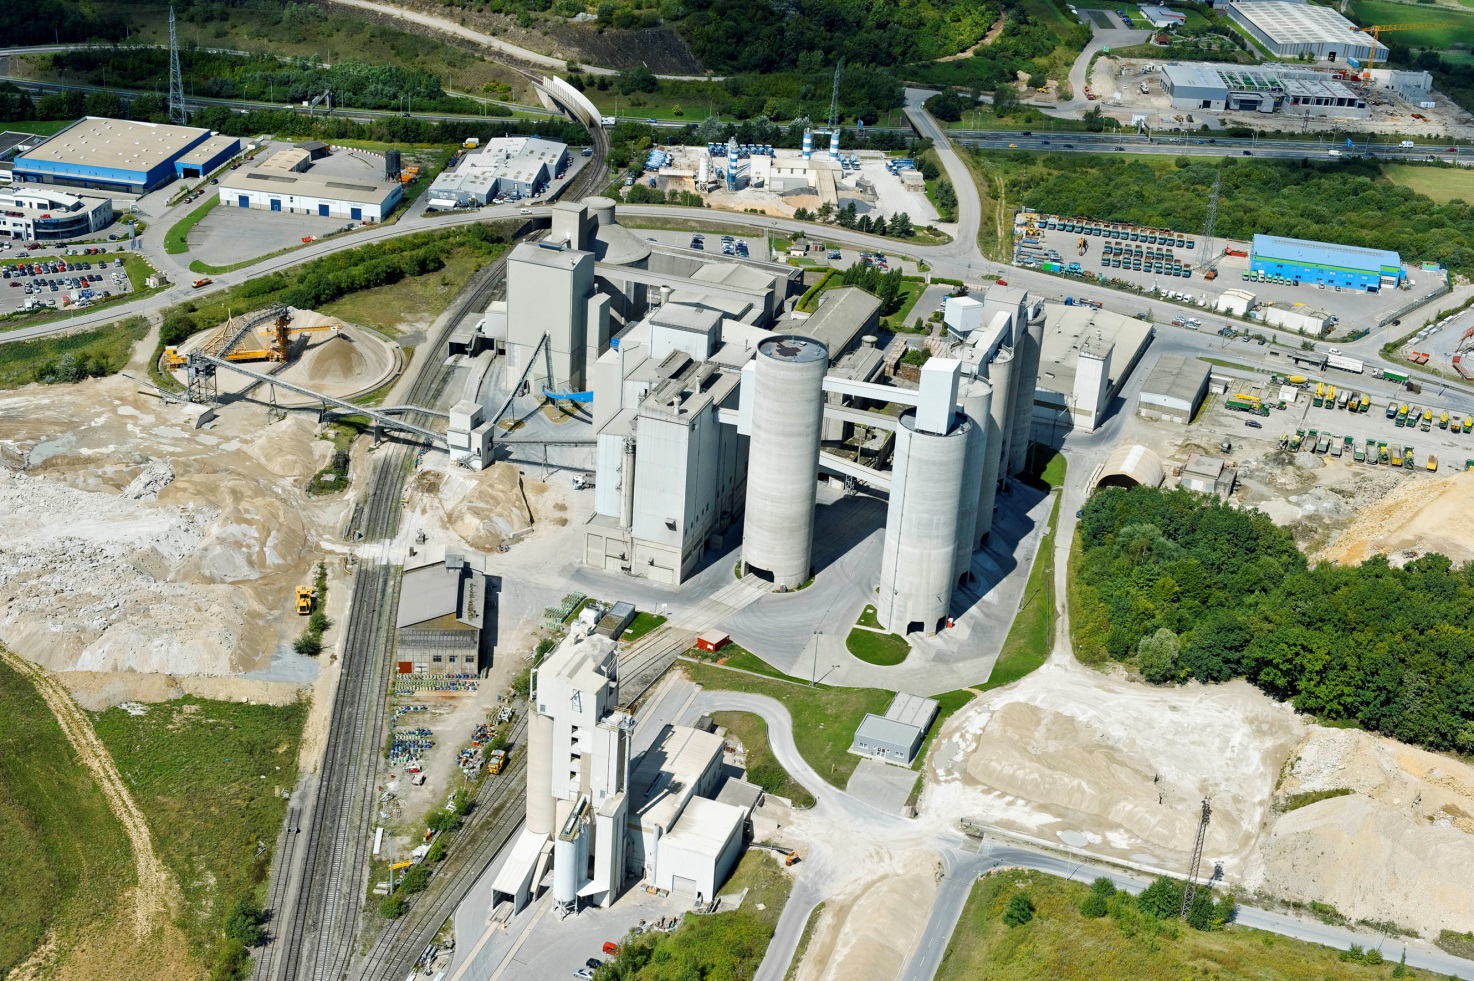
Cement production: The case of Cimalux
Cement is a fine powder that when submerged in water undergoes a transformation into a paste that binds and hardens. It is the main component of concrete, an economical, high-quality construction material used in construction projects worldwide.
The primary component of cement is clinker. To produce clinker, limestone and other clay-like materials are heated at 1450°C in a rotary kiln. It is then ground with gypsum and other materials to form cement. “A CO2 efficient type of cement like common blast furnace cement contains less than 330 kg CO2 per tonne. This corresponds to less than 120 kg per m3 of concrete.” explains Christian Rech, engineer at Cimalux26, a Luxembourg-based cement producer. While concrete can indeed be very CO2 efficient, it is the sheer volume used around the world that makes cement production contribute to approximately 6% of worldwide anthropogenic CO2 emissions. In the EU, the cement industry is impacted by the EU ETS system.
As Dr Oerter, Technical Director of Cimalux clarifies, CO2 emissions of cement production originate from three distinct sources:
- First, there are direct emissions that occur through a chemical process called calcination. Calcination occurs when limestone, which is made of calcium carbonate, is heated, breaking down into calcium oxide and CO2. This process accounts for roughly 60% of all emissions from cement production. In other words: 60% of the industry’s emissions are ‘process emissions’ caused by decarbonation of limestone during the production process.
- A second source for direct emissions is the use of fossil fuels. The clinker burning process is energy-intensive and fuels are necessary for heating the kiln. Kilns are usually heated by coal, natural gas, or oil, and the combustion of these fuels produces additional CO2 emissions. This represents around 30% of cement’s emissions.
- Finally, the electricity used to power additional plant machinery and the grinding of cement represents another indirect source of emissions and accounts for about 10% of the CO2 emissions attributable to cement production.
“EU ETS increases the price of cement production within the EU, which has not gone unnoticed by producers from outside EU borders,” Mr Rech says. Cement is a product with a homogenous and comparative quality across competitors and despite its central role in the construction industry, it is a commodity that is widely available. With little or no organic growth in the market, competition for new market shares is fought over price. This situation makes it very difficult to pass additional costs, inflicted by ETS, to customers.
Increasing prices of EU-produced cement bear the potential of attracting further attention at international markets and supply chains. Dr Oerter explains that the EU ETS has a growing influence on the costs of cement manufacturing within the EU. And the higher the cement prices within the EU, the more the European market is jeopardised by imports from countries which do not have to tackle the burden of a CO2 emission trading system. As a matter of fact, those European areas and countries which are easily accessible via huge harbours or rivers are potentially more affected by these scenarios. Mr Rech considers the application of border adjustment taxes for producers from outside the EU Emission Trading System a complicated system and does not expect it to yield realistic protection for the local cement industry. The administrative and reporting burden, as well as lack of legal certainty, and inherent sectorial discrimination, are known flaws of this system. Creating a level playing field with similar climate-related constraints across all major trading partners of the EU would certainly be more effective than protecting borders by carbon taxes.
Nevertheless, the cement industry is supportive of EU climate efforts and already contributes to reducing the CO2 intensity of its products through numerous initiatives. The European Cement Association highlights, for example, that over the past 24 years a 21% reduction of CO2 per tonne of cementitious material has been achieved. There are currently three major levers available to reduce CO2 emissions in cement production, Dr Oerter says:
- Substitution of raw material: Increasing the usage rate of non-limestone materials;
- Usage of alternative fuels: Raising the substitution rate of fossil fuels necessary to heat the kiln;
- Reduce the amount of clinker in cement.
Dr Oerter explains that for the substitution of raw materials, the limestone needed to make clinker can be partially substituted by a range of alternative calcium and magnesium containing materials, including waste and industrial by-products, which are being used increasingly already today. For example, sewage sludge has a low but still significant calorific value and produces ash that becomes a raw material used to make clinker. Cimalux’ performance in the recovery of alternative raw materials such as slags from other industrial processes can be considered among the best in class. Nevertheless, further research into the use of suitable alternative raw materials and efforts to ensure access to these materials is necessary.
Alternative fuels, including a high proportion of pretreated waste products, are being used more and more as a source of energy to heat the kiln. They now represent about 40% of the overall energy demand in the EU cement industry. Tyres, sludges, non-recyclable solvents, refuse-derived fuels and other types of waste can be used as alternative fuels. By doing so, the cement industry also plays an active role in upcycling those materials that would otherwise be burned with less added value or dumped into a landfill. Cimalux has also made considerable efforts in using alternative fuels and today alternative fuels account for approximately 50% of fuels used in its heating processes.
As for the reduction of clinker in cement: High-performance cements are being explored that provide concretes with high performances while using less clinker. Such R&D efforts in combination with research on alternative binders for cement are being undertaken. So far, however, cost versus performance of the ‘traditional’ cement and concrete mix is hard to beat with new technologies. Furthermore, innovation cycles in the construction sector tend to be long and costly due to severe security norms. In this field, major changes cannot be expected rapidly either because they require a joint effort across the whole value chain of the construction industry including architects, civil engineers, and the construction material companies.
These CO2 reduction efforts represent major investments and show the eagerness of the cement industry to contribute to reaching climate objectives. Such investment is however only viable if climate actions such as EU ETS do not harm the competitiveness of the industry. Moving forward with climate actions while preserving the cement industry’s competitiveness is thus a prerequisite, and it is possible as long as enough free allowances will prevent a penalisation of the local cement industry. According to Dr Oerter, one of the most important aspects to stay competitive is that annual reduction rates of free allocations must be aligned with technical limits of current cement production processes. The annual linear reduction rates of free allocations, as already applied in Phase 3 and bound to be further tightened in Phase 4, tend to reduce free allocations towards zero. Current and near future technologies, however, do not yet allow cement production in a zero-emissions context. Even by taking all the best currently available technologies into account, emission-free cement production would be hardly possible today. Also, in the future, carbon capture and storage or reuse will be inevitably needed technologies to fully eliminate CO2 emissions from cement production. In other words, the cement industry has a hard time following the pace of ever ambitious climate objectives because alternative technologies are not yet ready and are not developing rapidly enough. The multiplication of research and development, as well as investment efforts, are necessary to preserve the competitiveness of the EU and Luxembourg cement industry in the future.
Glass production: The case of Guardian Industries
Guardian Europe, headquartered in Bertrange, Luxembourg, and a subsidiary of the global manufacturer Guardian Glass, based in the United States, has been manufacturing glass in Europe since the opening of its Bascharage-Luxembourg plant in 1981. Guardian also manufactures glass in Dudelange, Luxembourg, and across Europe in plants in Spain, Hungary, Poland, Germany, and the UK. Guardian operates two plants in Russia and other sites around the world, including South America, Asia, Africa, and the Middle East. Guardian products are used in commercial and residential construction as well as transportation applications and can be found in some of the most iconic structures around the globe. Guardian is a leading producer of high-performance coatings on glass that help enhance the energy efficiency of buildings.
Guardian’s vision is to help people improve their lives by providing products and services they value more highly than their alternatives and do so responsibly while consuming fewer resources27.
©Frank Weber / ©Adrian Smith and Gordon Gill
The EU policy on EU Carbon Trading System (EU ETS) is applicable to all eight Guardian plants located in Europe, including the two plants in Luxembourg. When being asked for a statement, Guardian – as a member of the Glass for Europe trade association, which represents the flat glass sector – refers to the association’s response to the consultation on “Revision of the EU Emission Trading System (EU ETS) Directive” in March 2015, which reads as follows:
“The attribution of free allowances has helped innovation and industry to invest in the efficiency of its plants as they preserve investment capacity. It, therefore, drives innovation and emission reduction while ensuring the competitiveness of EU industries. However, this instrument alone does not guarantee full protection of industry against carbon leakage under Phase 3. Considering that the amount of free allowances is disconnected from industry needs (in particular due to the CSCF – Cross-Sectoral Correction Factor), CO2 allowances have to be acquired. This represents a cost for manufacturing industries that is not borne by most extra-EU competitors. Therefore, ‘artificial’ reduction factors not related to the benchmark – should be removed so that free allocations do not decrease at a faster pace than the sector’s technical ability to improve its CO2 efficiency.
Industry sectors exposed to risks of carbon leakage after 2020, Phase 4, should not face undue carbon costs leading to risks of carbon leakage and be given full and effective compensation under the form of free allowances. Manufacturing sites belonging to exposed sectors should receive enough free allowances, in line with updated CO2 benchmark figures and actual production. The cross-sectoral correction factor needs to be abandoned so that free allowances are not ‘artificially’ reduced.”
Conclusion
With the introduction of the EU Emission Trading System (EU ETS), the European Union has taken a global front runner position in its aim to reduce CO2 emissions. The system can be considered as one of EU’s flagship climate action policy instruments but until today, it remains the world’s only comprehensive emission trading system that imposes nationwide emission reduction constraints to large parts of its industry. At the same time, the somewhat bumpy road and mitigated impact of EU ETS to significantly reduce CO2 emissions in the industry raises the question of the system’s effectiveness in its current form.
The assessments given by FEDIL members in this article about EU ETS are widely shared among industrials from multiple energy-intensive sectors across Europe. Despite the willingness of energy-intensive sectors to contribute their share to mitigate climate change through responsible use of resources, there is a large consensus among industry representatives about the following two major issues of EU ETS:
- CO2 emission reduction trajectories imposed by the system on all major energy-intensive industries do not reflect feasible performance improvement potentials of current production technologies. At the same time, it is widely accepted that even with massive research and development efforts, new industrial scale, low CO2 emitting technologies and infrastructure will only be ready in 10 to 15 years, for certain sectors it may even take longer. Consequently, the gap of CO2 allowances that companies will need to purchase by auctioning to comply with EU ETS requirements will continue to widen with no change in short sight.
- EU’s ambitious climate policies are not equally echoed by its major trading partners. The resulting imbalances in climate policy requirements imposed on energy-intensive industries in the EU and its trading partners are thus increasingly undermining a level playing field for international competition.
These two elements further have a compounding negative economic and ecological effect: While additional production costs from EU climate policies will decrease EU industry’s global competitiveness and ultimately its global market shares, their non-EU counterparts will step up their less regulated production capacities to satisfy the newly gained market demands and thus driving up emissions disproportionately. The final stage of such a scenario will be marked by massive divestments of the EU’s energy-intensive industries to relocate production outside the EU in order to survive. Now operating in less regulated environments, those new production capacities installed outside EU borders are likely to emit more than if they had stayed within the EU.
It must, therefore, be the ambition of national and European climate policies to create framework conditions and attractive long-term investment perspectives to motivate energy-intensive industries to continue doing business from Europe while reducing emissions. All other approaches may help to reach short term local climate objectives, but they will not be effective to mitigate climate change – which remains a global challenge.